Computational models – like our own DELTA Model® – are often used to explore the future of the global food system. It can be easy to put lots of trust into these kinds of models: we trust that they were built by people who understand the system, were careful in their work, and used high quality data. But even when all these things are true, how exact are the outputs of these models? Within 5%, or within 50%? What are the implications of this uncertainty? In this Thought for Food article, we dive into model sensitivity and uncertainty, with examples from the DELTA Model®.
Sensitivity analysis and uncertainty analysis are related topics. Sensitivity analysis assesses which factors in a model (e.g. underlying data, calculation assumptions) matter most in determining model output, whereas uncertainty analysis assesses how confident we can be in model outputs given our uncertainty in the inputs. In the case of the DELTA Model®, we are interested in both what data and assumptions the model’s outputs are most sensitive to, and also how uncertain the outputs are given our uncertainty about the inputs.
But surely we are confident we used the best data and modelling assumptions in building the DELTA Model®? This is true, but even the best data has flaws. For example, it is known that the nutrient composition of foods varies seasonally, by location, and as a result of processing, and that food composition data is just the best possible approximation of a food’s composition across seasons and locations. Another example of flawed data is for food waste, which is only collected sporadically, leaving a patchy global picture.
These uncertainties led us to try to quantify the sensitivity and uncertainty of the DELTA Model® and its outputs. To do so, we identified all the underlying data and assumptions that could influence model outputs – including the allocation of products to food rather than other uses, food composition, food waste, food processing yields, and more. We then tweaked them one at a time to see which datapoints had the greatest impact on the model’s calculated global nutrient supply.
Unsurprisingly, the data with the biggest impact was the FAO estimates of the amount of each food commodity that becomes human food (as opposed to animal feed, supply chain losses, or other uses). Changes of just a few percent in these numbers could translate to the misallocation of millions of tonnes of food. Within these estimates, it was the cereal data that requires the most caution, as these are the foods consumed in the greatest quantities globally.
Beyond food allocation, we also identified the most sensitive datapoints in the food waste, food composition, and food processing data. While this was usually linked to cereals, again due to the importance of this food group in global diets, we also saw important sensitivity to vegetable, oilcrop, and dairy datapoints.
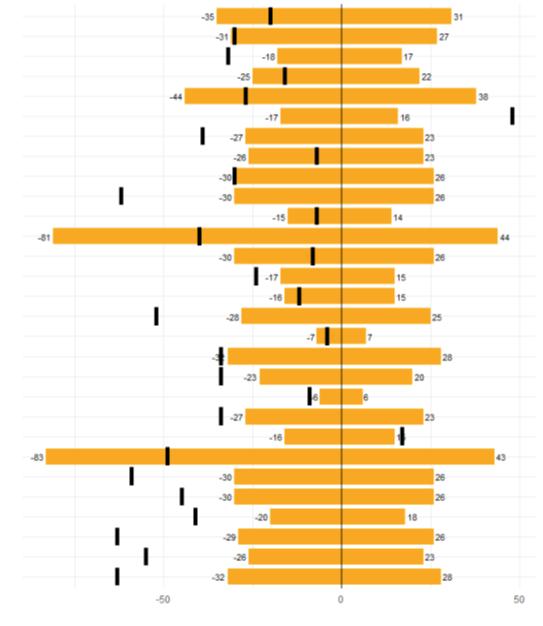
Now that we had a good view of the most important datapoints, we wanted to see how uncertainty across several of these at the same time would impact the model’s calculated nutrient supply. So, we varied every possible combination in both directions and measured the impact on each nutrient. Selenium, cystine, and carbohydrate supply were the most impacted, reflecting the dependence of the supply of these nutrients on cereals.
When we compared the variation in model output to global nutrient requirements, there were some instances where the variation led to a change from nutrient sufficiency to undersupply, particularly where supply was only just enough to meet sufficiency under normal model settings. However, there were no instances where an undersupply became sufficiency.